You are sitting on your couch, scrolling through financial news or watching a segment on CNBC, and suddenly the anchors start speaking in what sounds like a secret code. They mention “basis points,” “Treasury notes,” and the one phrase that seems to make everyone’s heart rate spike: the inverted yield curve.
If you are new to the world of investing, seeing grown adults in expensive suits get nervous about a “curve” on a graph can be confusing. It sounds academic, almost like a boring geometry lesson you might have skipped in high school. But in the world of money, this specific curve is often called the “crystal ball” of the economy.
When the yield curve does something unusual, it usually means the giant gears of the American economy are grinding in a way that could affect your savings, your job, and your mortgage. This guide is your “yield curve explained” roadmap. We are going to strip away the jargon and look at what this really is, why it matters to you, and why you should not panic when the headlines get loud.
What Exactly Is the Yield Curve?
Before we talk about the curve, we have to talk about bonds. Think of a bond as a “I owe you” note. When the United States government needs to spend money on things like roads, the military, or social programs, it often borrows that money from people like you and me.
When you buy a US Treasury bond, you are essentially lending your money to the government. In exchange for your loan, the government promises to pay you back your original money after a certain amount of time, plus a little extra for your trouble. That “extra” is the interest, also known as the yield.
Now, the government borrows money for different lengths of time. You can lend them money for 1 month, 2 years, 10 years, or even 30 years.
The yield curve is simply a line on a graph that shows the interest rates for all these different timeframes at any given moment. If you draw a line connecting the interest rate of a 3-month loan to a 30-year loan, that line is the curve.
The Time-Money Tradeoff
Under normal circumstances, if you lend someone money for a long time, you expect to get paid more.
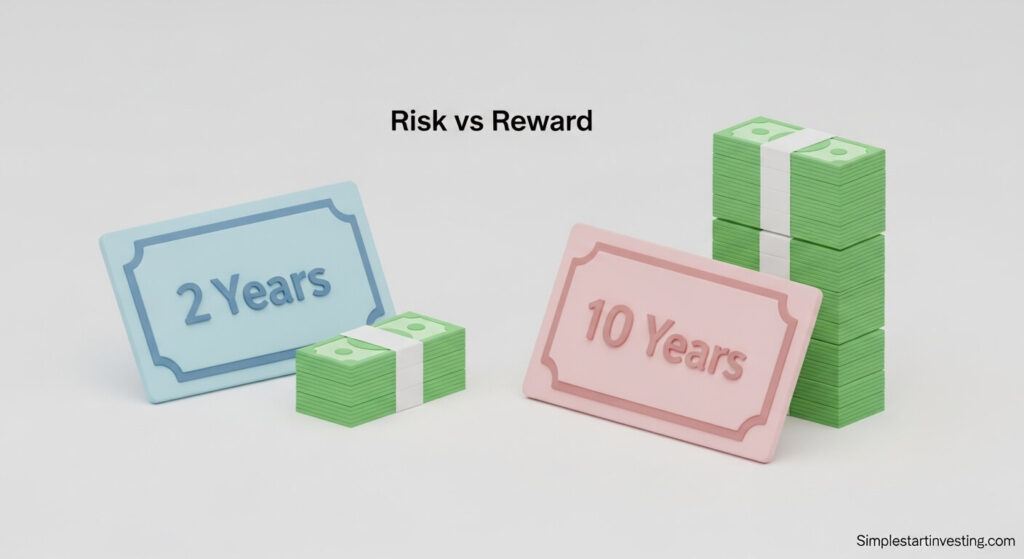
Imagine a friend asks to borrow 1,000 dollars. If they promise to pay you back tomorrow, you might not even ask for interest. If they promise to pay you back in 10 years, you are going to want a decent reward. Why? Because a lot can happen in 10 years. Prices could go up (inflation), you might need that money for an emergency, or your friend might not be around to pay you back.
Because of this risk and the “wait time,” long-term loans usually have higher interest rates than short-term loans. This is the foundation of a normal yield curve. It starts low on the left (short-term) and slopes upward to the right (long-term).
Why Is Everyone Obsessed With the 10-Year and the 2-Year?
While there are many different types of Treasury bonds, investors usually focus on two specific ones to see how the “health” of the economy is doing:
- The 2-Year Treasury Note: This represents what people think will happen with interest rates in the very near future.
- The 10-Year Treasury Note: This represents the long-term outlook for the economy and inflation.
When financial analysts talk about the curve “inverting,” they are almost always looking at the gap between these two. Usually, the 10-year note should pay you significantly more than the 2-year note. If the 2-year starts paying more than the 10-year, something is broken in the market’s logic.
The Three Shapes of the Curve
To understand why the “Inverted” version is so scary, we need to look at what the curve looks like on a typical Tuesday.
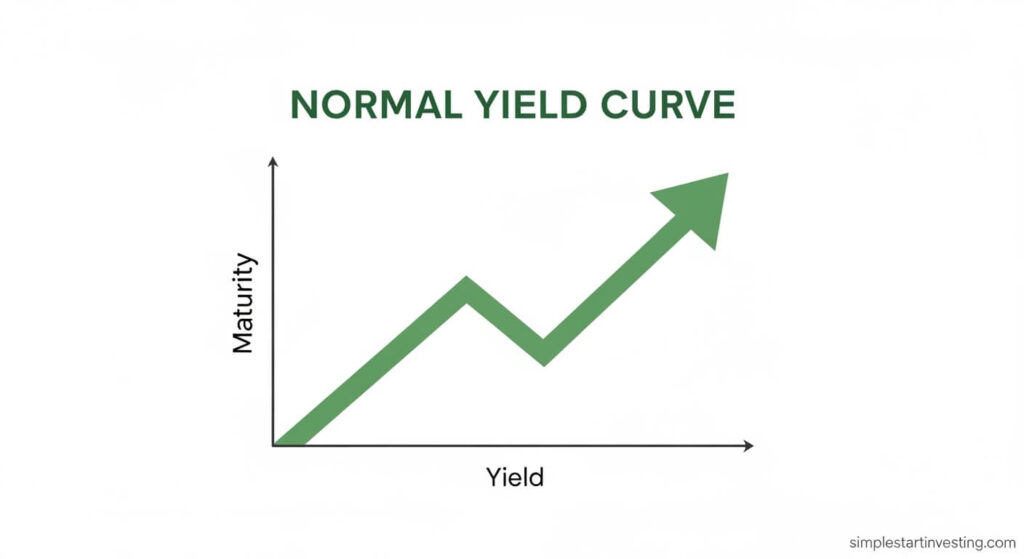
1. The Normal Curve (The Upward Slope)
In a healthy, growing economy, the curve looks like a gentle hill.
- The logic: Investors are optimistic. They expect the economy to keep growing. They want a higher return for locking their money away for a long time.
- What it means for you: Banks are happy to lend money for houses and cars because they can borrow at low short-term rates and lend to you at higher long-term rates.
2. The Flat Curve (The Warning Sign)
Sometimes the hill starts to level out. The difference between what you get for a 2-year loan and a 10-year loan becomes very small.
- The logic: Investors are becoming unsure. They are worried that growth might slow down or that the Federal Reserve might raise interest rates too quickly to fight inflation.
- What it means for you: This is a “wait and see” moment. The economy is in a transition phase.
3. The Inverted Curve (The Upside-Down World)
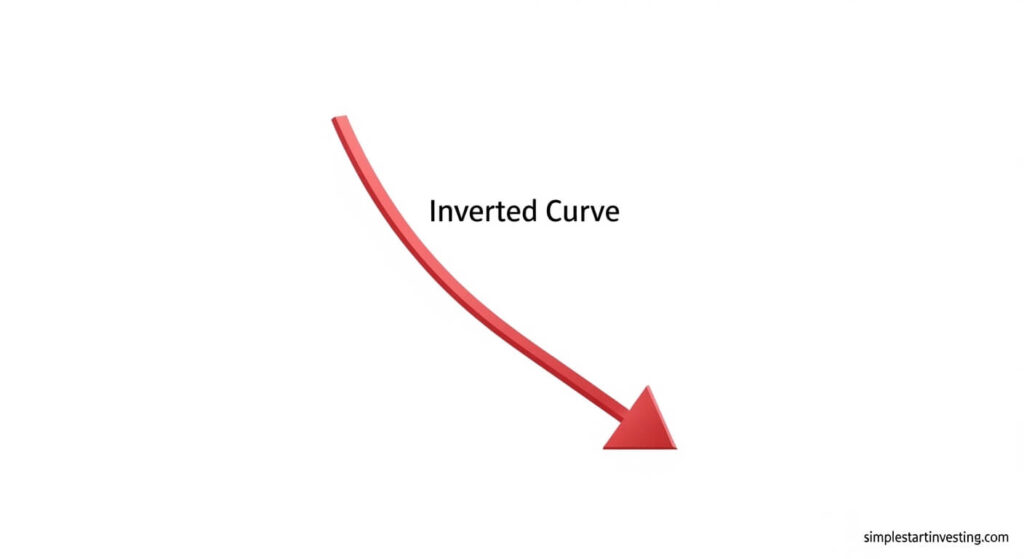
This is the one that causes the panic. An inverted yield curve happens when short-term bonds pay a higher interest rate than long-term bonds.
- The logic: Investors are so worried about the immediate future that they are willing to accept a lower rate for a long-term bond just to “lock in” their money safely. They expect interest rates to drop in the future because they expect the economy to get worse.
- What it means for you: This is the market’s way of screaming, “A recession might be coming!”
Why Does Inversion Predict a Recession?
You might wonder, “Why does a weird line on a graph tell us when people are going to lose their jobs?” It isn’t magic; it is a reflection of investor psychology and banking mechanics.
The Banking Problem
Banks are the engine of the economy. They make money through a simple process: they borrow money at short-term rates (like the interest they pay you on your savings account) and they lend it out at long-term rates (like your 30-year mortgage).
When the yield curve inverts, the bank’s profit disappears. They would have to pay more to “borrow” money than they would make by “lending” it out. When banks can’t make a profit on loans, they stop lending.
- It becomes harder to get a small business loan.
- Mortgage requirements get stricter.
- Credit card limits might not be increased.
When the flow of money slows down, the economy slows down. Businesses stop expanding, hiring freezes begin, and eventually, we hit a recession.
The “Self-Fulfilling Prophecy”
There is also a psychological element. Since an inverted yield curve has predicted almost every recession since the 1950s, when people see it happen, they get scared.
- Businesses cut back on spending because they expect a recession.
- Consumers stop buying new cars or appliances because they are worried about their jobs.
- Because everyone acts like a recession is coming, their collective behavior actually causes the recession.
Common Misconceptions Beginners Have
When you first learn about this, it is easy to fall into a few traps. Let’s clear those up so you can think like a seasoned investor.
Misconception 1: “The recession will start tomorrow.”
The yield curve is a “leading indicator.” This means it tells you what might happen in the future, not what is happening right now. In the past, a recession has sometimes taken 6 months, 12 months, or even 24 months to arrive after the curve first inverts. It is a slow-motion warning, not an immediate crash.
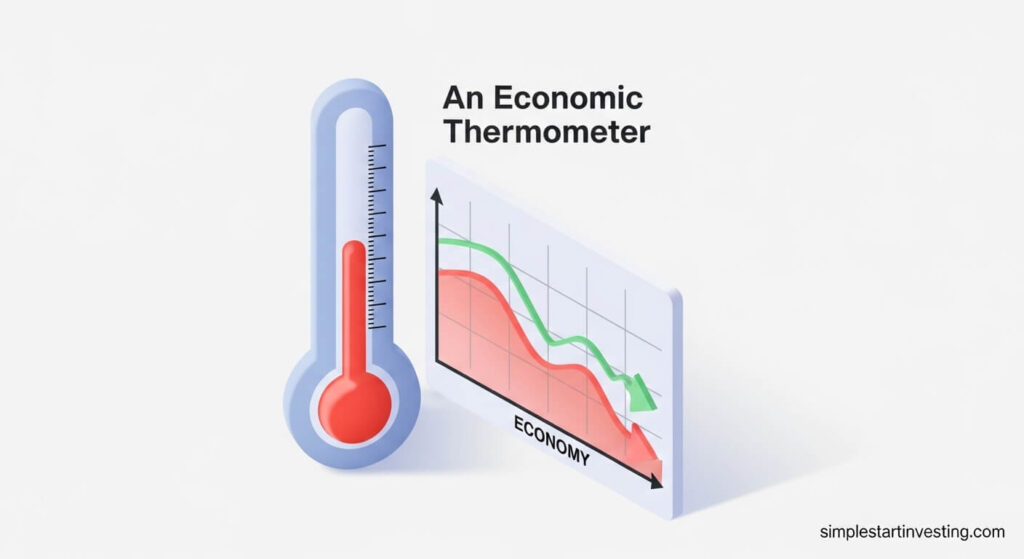
Misconception 2: “The curve causes the recession.”
The curve is the thermometer, not the fever. If a thermometer says you have a temperature of 103 degrees, the thermometer didn’t make you sick—it just reported the state of your body. Similarly, the yield curve just reports the “sickness” or “health” of how investors are feeling about the future.
Misconception 3: “I should sell all my stocks right now.”
This is the most dangerous mistake. Markets are unpredictable. Sometimes the curve inverts, and the stock market continues to go up for another year before a recession hits. If you sell everything the moment you see a headline about an inversion, you might miss out on significant gains.
How Does This Affect Your Daily Life?
Even if you don’t own a single stock, the yield curve still touches your wallet.
Your Savings Account
When the yield curve is inverted because the Federal Reserve has raised short-term interest rates, you might notice that your High-Yield Savings Account (HYSA) or CDs (Certificates of Deposit) are suddenly paying 4% or 5% interest. This is the “bright side” for savers. The government and banks are desperate for short-term cash, so they pay you more for it.
Your Mortgage and Loans
Generally, mortgage rates follow the 10-year Treasury yield. If the 10-year yield stays low because investors are worried about the future, mortgage rates might not rise as much as you’d expect, even if the Fed is raising other rates. However, because banks are worried about a recession, they might make it much harder for you to qualify for that loan.
Your Job Security
An inverted yield curve is a signal for big companies to “tighten their belts.” If you see the curve stay inverted for a long time, it is a good time to ensure your emergency fund is full and your resume is up to date. You don’t need to panic, but you should be “weather-aware.”
What Should a New Investor Do?
So, the news says the curve is inverted. What is the “Simple Start” strategy?
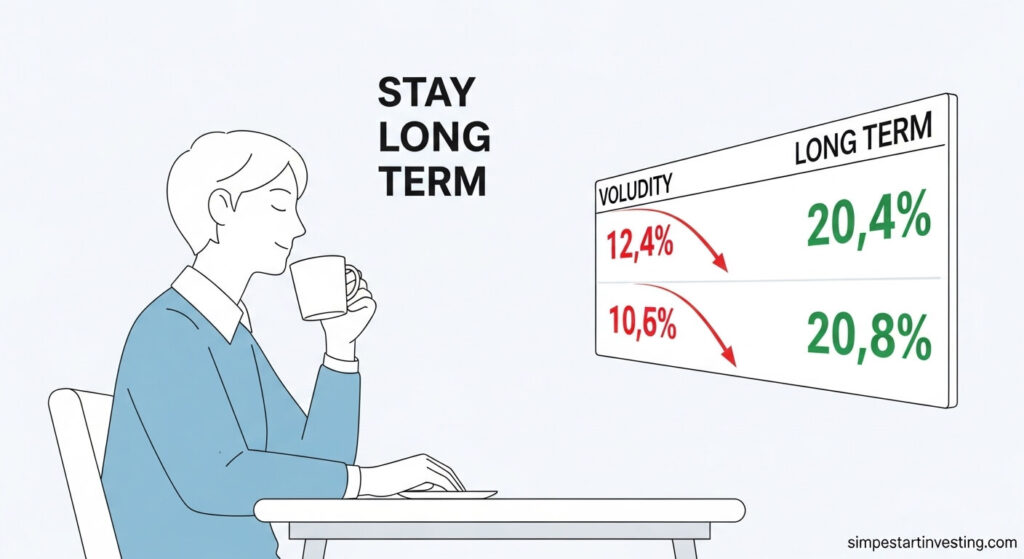
1. Don’t Time the Market
As the saying goes, “The market can stay irrational longer than you can stay solvent.” Trying to guess the exact day a recession starts based on the yield curve is a losing game. Stick to your long-term plan. If you are investing for retirement 20 years from now, a recession next year is just a small dip on a long road.
2. Check Your Asset Allocation
If the yield curve is signaling a recession, it’s a great time to ask: “Am I taking too much risk?” If you have 100% of your money in “risky” stocks and you won’t be able to sleep if they drop 20%, maybe you should have a bit more in “safer” things like bonds or cash. Not because of the curve, but because your personal risk tolerance might be lower than you thought.
3. Look for Opportunities
Recessions are often the best time to buy great companies at a discount. Instead of fearing the inversion, look at it as a “sale warning.” It is telling you that in the next year or two, things might get “cheaper” in the stock market. If you have a steady job and extra cash, this could be your chance to build wealth.
The Concept of “Un-Inversion”
Lately, you might hear a new term: “steepening” or “un-inversion.” This happens when the curve starts to go back to its normal shape.
Wait—isn’t that a good thing? Not necessarily.
Historically, the recession often starts after the curve starts to fix itself. This is because the Federal Reserve realizes the economy is breaking and starts cutting short-term rates very quickly to try and save it. When those short-term rates drop fast, the curve “un-inverts.”
The lesson here? Don’t just watch the inversion. Watch the whole lifecycle of the curve.
A Simple Real-World Example
Let’s imagine you are at a local fair. There are two “Money Booths.”
- Booth A (The 2-Year Booth): They say, “Give me 100 dollars, and I’ll give you 105 dollars back in two years.” (That’s a 5% gain).
- Booth B (The 10-Year Booth): They say, “Give me 100 dollars, and I’ll give you 104 dollars back in ten years.” (That’s only a 4% gain).
You would think Booth B is crazy! Why would you wait 10 years to make less money than you could make in 2 years?
The only reason you would choose Booth B is if you believe that in two years, Booth A will be closed or only offering 1 dollar. You are so scared of what the “future” fair looks like that you’d rather lock in a mediocre 4% for ten years than take the 5% now and have nowhere to put your money later.
That is exactly what is happening in the bond market when the curve inverts. The “smart money” is terrified of the future.
Summary for the Beginner
The yield curve is not a monster under the bed. It is a very useful tool that aggregates the feelings of millions of investors into one single line.
- Normal: Economy is growing.
- Inverted: Investors are worried, and a recession might be on the horizon.
- Your Move: Stay calm, keep your emergency fund ready, and don’t make emotional decisions with your long-term investments.
Economics can feel like a different language, but at its heart, it is just a study of how people feel about their “tomorrow.” The yield curve is simply a way to measure that feeling. Now, the next time you hear a news anchor mention “the 10-year and the 2-year,” you can sit back, sip your coffee, and know exactly what they are talking about.
Disclaimer: This content is for educational purposes only and does not constitute financial advice. Market conditions change rapidly, and you should consult with a qualified professional before making any major investment decisions.