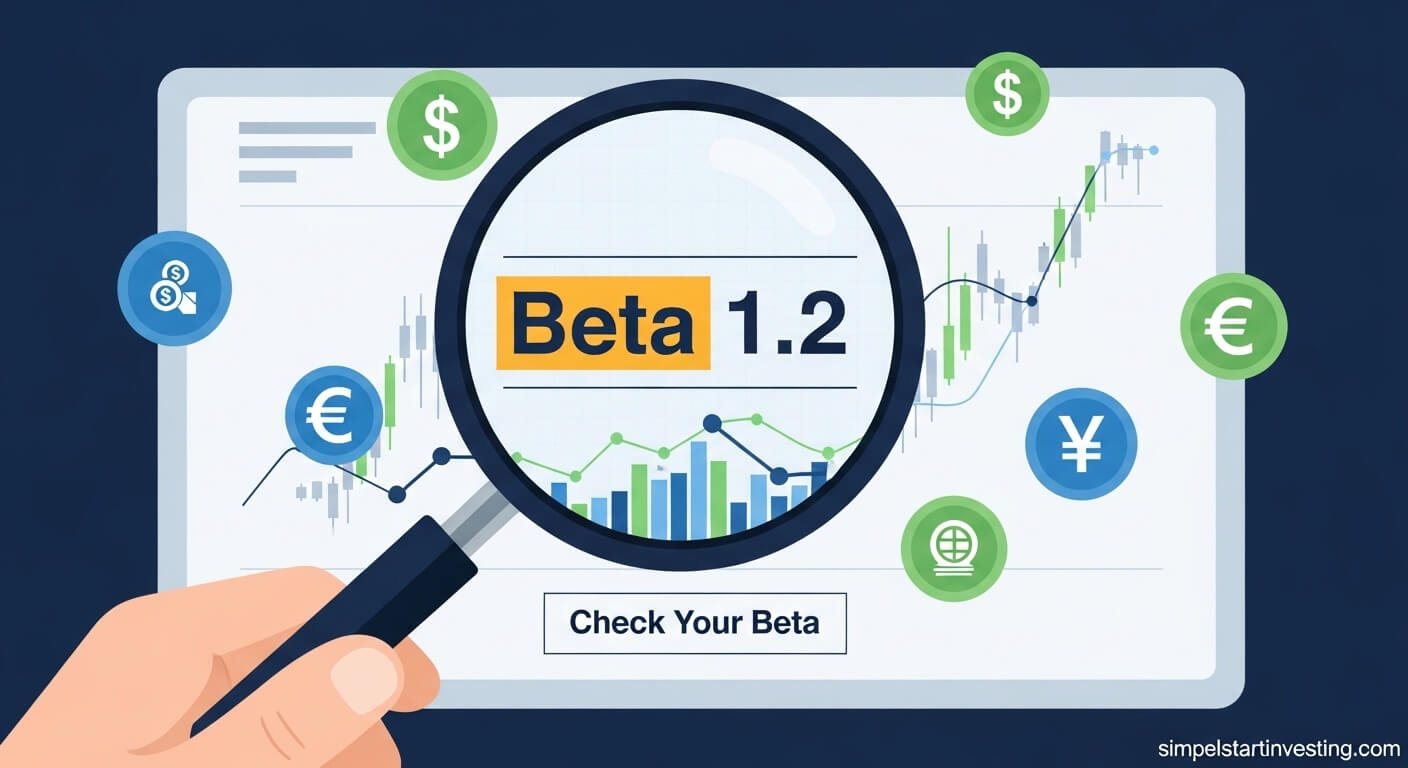
If you have ever opened your brokerage app and felt your heart skip a beat because your favorite stock dropped 5% while the rest of the market only dropped 1%, you have already experienced Beta in action. You just didn’t have a name for it yet.
In the world of investing, we often talk about “risk” as this big, scary cloud. But for most beginners, risk isn’t just about losing money; it is about the emotional rollercoaster of price swings. Some stocks are like a calm pontoon boat on a lake, while others are like a jet ski in a hurricane.

Understanding Beta is your way of knowing exactly which kind of boat you are stepping into before you leave the shore. It is a simple number that tells you how much a specific stock tends to “jiggle” or swing in price compared to the stock market as a whole.
By the end of this guide, you will understand how to use this number to build a portfolio that matches your personality, helping you stay calm even when the market gets choppy.
The Benchmark: Why the S&P 500 is the “Golden Ruler”
Before we can measure how much a stock moves, we need something to compare it to. In the US market, we usually use the S&P 500 Index. Think of the S&P 500 as the “average” of the 500 largest companies in America.
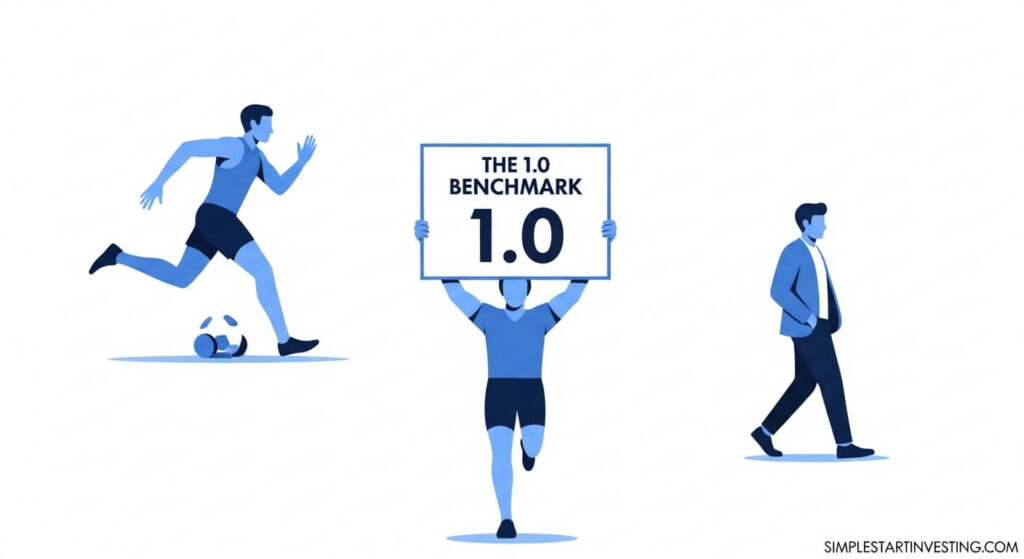
When people say “the market is up today,” they are usually talking about the S&P 500. Because it represents such a huge portion of the economy, we give the S&P 500 a permanent Beta of 1.0.
Every other stock is then measured against this 1.0 baseline.
- If a stock moves exactly like the market, its Beta is 1.0.
- If it moves more than the market, its Beta is higher than 1.0.
- If it moves less, its Beta is lower than 1.0.
It is like comparing different runners to a pacer. The pacer sets the standard speed (1.0). Some runners are sprinting way ahead and getting tired faster (High Beta), while others are power-walking behind at a steady, tireless pace (Low Beta).
Decoding the Numbers: What Does Your Stock’s Beta Actually Mean?
When you look up a stock on a site like Yahoo Finance or Google Finance, you will see a small section labeled “Beta (5Y Monthly).” This is simply looking at the last five years of data to see how the stock behaved.
Let’s break down what those specific numbers mean for your wallet without using any confusing math formulas.
The Steady Baseline: Beta of 1.0
If you buy a stock with a Beta of 1.0, you are essentially buying a mirror of the market. If the S&P 500 goes up 10% this year, your stock will likely go up about 10%. If the market crashes 20%, your stock will likely crash about 20%. You aren’t “beating” the market, but you aren’t falling behind it either. Many large, established companies that are part of almost every sector have a Beta very close to 1.0.
The High-Voltage Move: Beta Higher Than 1.0
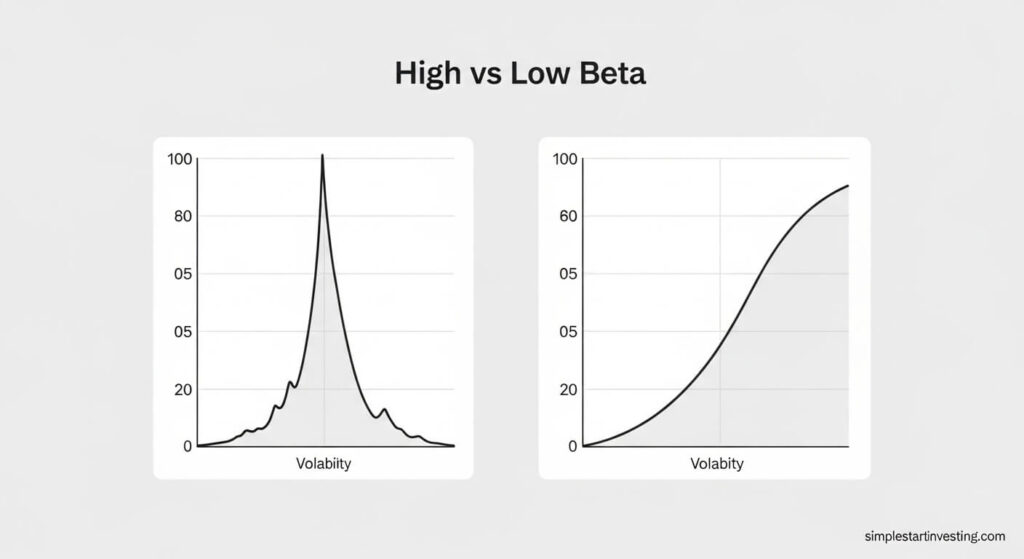
A stock with a Beta of 1.5 is 50% more volatile than the market. Imagine the market is a car driving down a bumpy road. The market car hits a bump and bounces 10 inches. The High Beta stock is like a passenger in the back seat who isn’t wearing a seatbelt—they bounce 15 inches.

- The Upside: When the market is booming and everyone is making money, High Beta stocks usually make more money. If the S&P 500 gains 10%, a stock with a 1.5 Beta might gain 15%.
- The Downside: When the market gets ugly, these stocks get uglier. If the market drops 10%, that 1.5 Beta stock could easily plunge 15%.
Common examples of High Beta stocks include Technology or Growth companies like Tesla (TSLA) or Nvidia (NVDA). These companies represent the future, so investors get very excited (buying high) or very scared (selling low) quickly.
The Slow and Steady: Beta Lower Than 1.0
A stock with a Beta of 0.5 is half as “jiggly” as the market. If the S&P 500 drops 10%, this stock might only drop 5%. It acts as a shock absorber for your portfolio.
These are often “boring” companies that provide things people need regardless of the economy. Think of companies like Walmart (WMT), Costco (COST), or utility companies that provide your electricity and water. Even if the stock market is crashing, people still need to buy groceries and keep the lights on. Because their earnings are steady, their stock prices don’t swing as wildly.
Why Beginners Often Misunderstand Beta
One of the biggest mistakes new investors make is thinking that a High Beta automatically means a “better” stock because it can go up faster. This is a dangerous way to look at your money.
Beta is not a measure of quality. It is only a measure of relative volatility.
A company could have a very high Beta and be a terrible business that eventually goes bankrupt. Conversely, a company could have a low Beta and be a fantastic, wealth-building machine over 30 years.
Another common misunderstanding is thinking Beta is a guarantee. Just because a stock has a Beta of 0.5 doesn’t mean it cannot drop 50% in a single day. If a company announces a massive fraud or their main factory burns down, the stock will plummet regardless of its historical Beta. Beta only measures how the stock moves in relation to the general market swings, not how it reacts to its own internal drama.
The Secret Language of “Negative Beta”
Occasionally, you might stumble upon a stock or an asset with a Negative Beta (less than zero). This is rare but fascinating. A negative Beta means the stock tends to move in the opposite direction of the market.
If the market goes down, the stock goes up. If the market goes up, the stock goes down.
Think of it like an umbrella business. When the “weather” in the stock market is sunny and beautiful, nobody is buying umbrellas, so the stock might sit still or drop. But when the “storm” hits and the market starts raining red numbers, everyone rushes to buy umbrellas, and the stock price climbs.
Historically, gold or certain “inverse” funds have shown negative Beta characteristics. For a beginner, you generally won’t see this often in individual stocks, but it is a good concept to know so you don’t panic if you see a minus sign in front of that number.
How to Use Beta to Manage Your “Sleep at Night” Factor
Investing is 10% math and 90% temperament. If you cannot sleep because you are worried about your stocks dropping, you probably have a portfolio with a Beta that is too high for your personality.
Here is how to use Beta to your advantage:
- Check Your Temperament: Are you the type of person who stays calm during a crisis, or do you tend to panic-sell when you see red? If you are prone to anxiety, look for stocks with a Beta between 0.5 and 0.9.
- Look at Your Timeline: If you are 22 years old and won’t touch this money for 40 years, you can afford a High Beta (1.2 to 2.0). The “jiggles” don’t matter because you have decades to wait for the market to recover.
- Balance the Scale: You don’t have to choose just one type. You can own some High Beta tech stocks for growth and some Low Beta utility stocks for stability. Together, they might give your total portfolio a comfortable Beta of around 1.0.
Real-World Scenario: A Tale of Two Stocks
Let’s imagine two neighbors, Sarah and Joe. They both start with 10,000 dollars.
Sarah buys “Steady Sam Corp,” which has a Beta of 0.7. Joe buys “Rocketship Tech,” which has a Beta of 1.8.
The market enters a “Correction” (a common event where the market drops 10%).
- The S&P 500 drops 10%.
- Sarah’s stock likely drops around 7%. Her account goes from 10,000 dollars to 9,300 dollars. She’s annoyed, but she can handle it.
- Joe’s stock likely drops 18%. His account goes from 10,000 dollars to 8,200 dollars. Joe panics, thinks the world is ending, and sells everything at the bottom.
Six months later, the market recovers and goes up 15% from its starting point.
- Sarah’s stock (Beta 0.7) would be up roughly 10.5% (0.7 times 15). Her 10,000 dollars is now 11,050 dollars.
- If Joe had stayed in, his stock (Beta 1.8) would be up 27% (1.8 times 15). His 10,000 dollars would be 12,700 dollars.
The lesson? High Beta offers the potential for higher returns, but only if you have the stomach to sit through the much deeper “jiggles.” If the “jiggle” makes you sell at the wrong time, Beta becomes your worst enemy.
Where Can You Find the Beta of a Stock?
You don’t need to do any math yourself. Professional analysts have already done it for you.
- Financial Websites: Go to Yahoo Finance, CNBC, or MarketWatch. Type in a ticker symbol like AAPL (Apple) or AMZN (Amazon).
- The Summary Tab: Look for a row or box that says “Beta (5Y Monthly).”
- Compare: Look at several different companies in different industries to see the difference. You will notice that a company like PepsiCo (PEP) has a much lower Beta than a company like Advanced Micro Devices (AMD).
The “Danger Zone”: When Beta Lies to You
As helpful as Beta is, it has some major limitations that every beginner needs to know. If you rely only on Beta, you are looking at the road through the rearview mirror.
1. It is purely historical
Beta is calculated based on what happened in the past. It assumes that the future will look just like the last five years. But companies change. A wild, high-growth startup might eventually become a slow, steady giant. If a company changes its business model, its old Beta becomes useless.
2. It ignores “Unsystemic Risk”
This is a fancy term for “stuff that only happens to one company.” Beta only measures how a stock moves with the market. It does not measure the risk of the CEO getting fired, a product being recalled, or a new competitor stealing all their customers. A stock could have a “safe” Beta of 0.8 and still go to zero dollars if the business fails.
3. It doesn’t account for “New” Stocks
If a company just went public (an IPO) last week, it doesn’t have enough history to have a reliable Beta. You might see “N/A” or a very weird number. For new companies, you have to look at the business itself, not the Beta.

Understanding Beta in the Context of Your Retirement
If you are looking at your 401(k) or IRA, you might see Beta mentioned in the “Risk” section of your mutual funds or ETFs.
A “Conservative” fund will target a Beta much lower than 1.0. An “Aggressive Growth” fund will often have a Beta much higher than 1.0.
As you get closer to retirement, most financial advisors suggest lowering the Beta of your overall portfolio. Why? Because when you are 65, you don’t have time to wait for a High Beta stock to recover from an 18% “jiggle.” You need that money to pay for your life now. You want the “boring” 0.5 Beta stocks that stay steady even when the market is throwing a tantrum.
Practical Steps for Your Next Move
Now that you know what Beta is, here is how to apply it today:
- Audit your current holdings: Look up the Beta for the top 3 stocks or funds you own. Are they higher or lower than 1.0? Does that surprise you?
- Match your stocks to your goals: If you have a “fun money” account where you want to take big swings, go for High Beta. For your “house down payment” fund, stick to Low Beta.
- Don’t fear the “jiggle”: Now that you can measure the “jiggle,” it shouldn’t scare you as much. When your High Beta stock drops, you can tell yourself, “This isn’t a disaster; it’s just Beta doing its job.”
Understanding Beta turns you from a gambler into a strategist. Instead of wondering why your stocks are moving the way they are, you will be able to predict the “swing” and plan accordingly. You aren’t just buying a ticker symbol; you are choosing the intensity of your investment journey.
Decide today: Do you want the thrill of the sports car or the safety of the SUV? Neither is wrong—you just need to know which one you are driving.
Disclaimer: This content is for educational purposes only and does not constitute financial advice. Market conditions change rapidly, and historical performance (like Beta) is never a guarantee of future results. Always consult with a qualified professional before making investment decisions.