Have you ever looked at a stock price and wondered if it was actually a good deal? Maybe you saw Apple trading at 250 dollars and thought it looked expensive, while another company trading at 20 dollars seemed like a bargain. In the world of investing, the price tag on a single share tells you almost nothing about the actual value of the company. To find out if a stock is truly “on sale” or “overpriced,” you need to look at the P/E ratio.
The P/E ratio, which stands for Price-to-Earnings ratio, is the most common tool used by investors in the United States to measure a company’s value. It helps you understand how much you are paying for every 1 dollar of profit the company makes. Think of it as the “price per pound” at the grocery store; it allows you to compare different items to see which one gives you the most for your money.

In this guide, we will break down the P/E ratio so you can stop guessing and start calculating like a seasoned investor. We will explore why a low price isn’t always a deal, why high growth often comes with a higher price tag, and how you can use this metric to build a stronger portfolio this year.
What Exactly Is the P/E Ratio?
At its simplest level, the P/E ratio is a way to see how the stock market values a company’s profits. If you were buying a local lemonade stand, you wouldn’t just ask for the price; you would ask how much money that stand makes every year. The P/E ratio does exactly that for giant corporations like Amazon or Walmart.
To understand this concept, let’s imagine a simple scenario. Suppose a company called “Best Coffee Corp” has a stock price of 100 dollars. Last year, that company earned a total of 5 dollars in profit for every share of stock that exists. To find the P/E ratio, you take the stock price of 100 dollars and divide it by the earnings of 5 dollars. This results in a P/E ratio of 20.
In plain English, this means you are paying 20 dollars for every 1 dollar of profit the company produces. If the P/E ratio was 10, you would only be paying 10 dollars for that same 1 dollar of profit. Generally speaking, a lower number suggests a “cheaper” stock, while a higher number suggests a more “expensive” one. However, as we will see, “expensive” isn’t always a bad thing.
Why the Stock Price Alone Is Deceiving
Many new investors make the mistake of looking only at the “sticker price” of a stock. They might see a share of Tesla at 400 dollars and a share of Ford at 12 dollars and assume Ford is the better deal because they can buy more shares with their 1,000 dollars. This is a classic beginner’s trap.

Imagine you are looking at two different apartment buildings. Building A costs 1 million dollars but brings in 100,000 dollars in rent every year. Building B costs 500,000 dollars but only brings in 10,000 dollars in rent. Even though Building B has a lower total price, Building A is actually the better investment because it generates much more income relative to its cost.
The P/E ratio is what allows you to see this difference in the stock market. It levels the playing field so you can compare a high-priced tech giant with a low-priced utility company. Without it, you are essentially flying blind, choosing stocks based on the size of the number rather than the strength of the business.
The Two Types of P/E Ratios You Must Know
When you look up a stock on a site like Yahoo Finance or Google Finance, you will often see two different versions of this metric. Understanding the difference is crucial for making informed decisions.

1. Trailing P/E (Looking at the Past)
The Trailing P/E ratio is calculated using the company’s actual profits from the past 12 months. It is based on hard data and official reports filed with the SEC. Because it uses real numbers that have already happened, it is considered very reliable. It tells you exactly what happened in the recent past.
2. Forward P/E (Looking at the Future)
The Forward P/E ratio uses “estimated” earnings for the next 12 months. Analysts and experts try to predict how much profit the company will make in the coming year. This is helpful because the stock market is always looking forward. However, because it is based on estimates, it can be wrong if the company has a bad year or if the economy shifts unexpectedly.
A Common Beginner Mistake: Many beginners only look at the Trailing P/E because it feels safer. They see a company with a great history and assume it will continue forever.
The Mindset Shift: Experienced investors look at both. If a company has a Trailing P/E of 30 but a Forward P/E of 15, it means experts expect the company’s profits to double next year. This could make a “high” current price actually look like a bargain for the future.
Industry Matters: Comparing Apple and JPMorgan
You cannot compare the P/E ratio of a tech company to the P/E ratio of a bank and expect to get a clear answer. Every industry in the United States has its own “normal” range for these numbers.

For example, let’s look at Apple (AAPL). Tech companies often have higher P/E ratios, sometimes reaching 30 or 35. This is because investors expect tech companies to grow rapidly, invent new products, and dominate the future. People are willing to pay a “premium” today because they believe the profits will be much higher five years from now.
On the other hand, let’s look at a major bank like JPMorgan Chase (JPM). Banks are considered “Value” stocks. They are steady, they grow slowly, and they pay dividends. It is very common to see a bank with a P/E ratio of 12 or 15. If JPMorgan suddenly had a P/E ratio of 35, investors would get worried because that is much higher than is normal for the banking industry.
The Lesson: Always compare a company’s P/E ratio to its competitors in the same industry. Comparing Apple to Microsoft makes sense; comparing Apple to ExxonMobil does not.
The “Value Trap”: When Cheap Is Actually Broken
One of the most dangerous traps for a new investor is the Value Trap. This happens when you see a stock with an incredibly low P/E ratio—maybe as low as 5 or 6—and you think you’ve found the deal of a lifetime. You buy in, expecting the price to go up, but instead, it keeps falling.

Why does this happen? Usually, it’s because the “Earnings” part of the ratio is about to disappear. The stock market is smart. If a company’s P/E ratio is very low, it often means that most investors expect the company’s profits to crash in the near future. Maybe their main product is becoming obsolete, or they are facing a massive lawsuit.
Real-World Example: Imagine a traditional gasoline car manufacturer that refuses to build electric vehicles. Their stock might look “cheap” with a P/E ratio of 5, while Tesla looks “expensive” with a P/E ratio of 60. But if consumers stop buying gas cars, that “cheap” company will eventually have zero earnings. A P/E ratio of 5 on zero earnings is still a bad investment.
The Correct Logic: Don’t just look for the lowest number. Ask why the number is low. If the company is healthy and just temporarily out of favor, it’s a bargain. If the company is failing, it’s a trap.
Growth Stocks and the “High P/E” Mystery
On the flip side, you will see some companies with astronomical P/E ratios. Some high-growth tech or biotech companies might have a P/E ratio of 100 or even higher. To a beginner, this looks like a total rip-off. “Why would I pay 100 dollars for 1 dollar of profit?” you might ask.
The reason is growth. If a company is doubling its profit every single year, that P/E ratio will drop very quickly even if the stock price stays the same. Investors are paying for what the company will become, not what it is today.
Think of Amazon in its early years. For a long time, it had almost no profit because it was reinvesting everything into warehouses and technology. Its P/E ratio looked insane or didn’t even exist because profits were so low. But those who understood the growth potential and looked past the simple ratio made a fortune.
How Interest Rates Affect Your Stocks
It is important to understand that the Federal Reserve (the central bank of the U.S.) has a huge impact on P/E ratios. When interest rates are low, people are more willing to pay higher prices for stocks because they can’t make much money in a savings account or bonds. This pushes P/E ratios up across the entire market.

When interest rates rise, like they have in recent years, investors start to demand more for their money. They might decide that a “safe” 5 percent return from a government bond is better than risking money on an “expensive” stock with a P/E ratio of 40. This often causes stock prices to drop until the P/E ratios reach a more reasonable level.
This is why you should always keep an eye on the broader economy. If the Fed is raising rates, you might want to be more cautious about stocks with very high P/E ratios. If rates are falling, those high-growth stocks might start to look more attractive again.
3 Steps to Use the P/E Ratio Today
Now that you understand the theory, how do you actually use this information when you open your brokerage account? Follow these three steps:
1. Find the Average for the Industry
Before you judge a company, look up the average P/E ratio for its sector. You can find this on most financial news websites. If the average for “Retail” is 20 and the company you like is at 15, you might have found a deal.

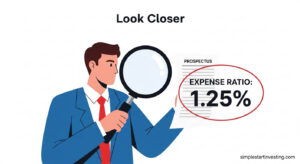
2. Check the Historical Trend
Look at what the company’s P/E ratio has been over the last five years. If Coca-Cola usually trades at a P/E of 25 but is currently at 18, it might be a good time to look closer. If it’s usually at 20 but is currently at 40, you might want to wait for a price drop.
3. Look at the Earnings Growth
A P/E ratio of 30 is fine if the company is growing its profits by 20 percent a year. But a P/E ratio of 30 for a company that isn’t growing at all is very risky. Always pair the “Price” with the “Growth.”
When the P/E Ratio Fails
As helpful as it is, the P/E ratio is not a magic wand. There are times when it simply doesn’t work.
- Companies with no profit: If a startup is losing money, it has no “Earnings,” so it doesn’t have a P/E ratio. In this case, you have to use other tools, like the Price-to-Sales ratio.
- One-time events: Sometimes a company sells a piece of land or settles a big lawsuit, which makes their earnings look huge for just one year. This will make the P/E ratio look artificially low. Always check if the earnings are “recurring” or just a one-time fluke.
- Cyclical companies: Companies like airlines or oil drillers have profits that go up and down wildly with the economy. Their P/E ratios can be very misleading at the peak or bottom of an economic cycle.
Final Thoughts for the New Investor
The P/E ratio is one of the most powerful tools in your investing toolbox. It moves you away from “gambling” on stock prices and toward “investing” in businesses. By understanding that you are buying a stream of future profits, you can make much smarter decisions about where to put your hard-earned money.
Remember, no single number can tell you everything. Think of the P/E ratio as a “check engine light” for a stock. If it’s too high or too low, it’s a signal to pop the hood and look at the actual business. Is the company growing? Do they have a lot of debt? Is their industry healthy?
By combining the P/E ratio with a bit of common sense and research, you will be well on your way to building a portfolio that can stand the test of time.
Disclaimer: This content is for educational purposes only and does not constitute financial advice. Investing involves risk, and past performance is not indicative of future results. Always conduct your own research or consult with a qualified financial professional before making investment decisions.